


This website uses cookies so that we can provide you with the best user experience possible. Cookie information is stored in your browser and performs functions such as recognising you when you return to our website and helping our team to understand which sections of the website you find most interesting and useful. You can view our complete Privacy Policy here.
Fact Friday
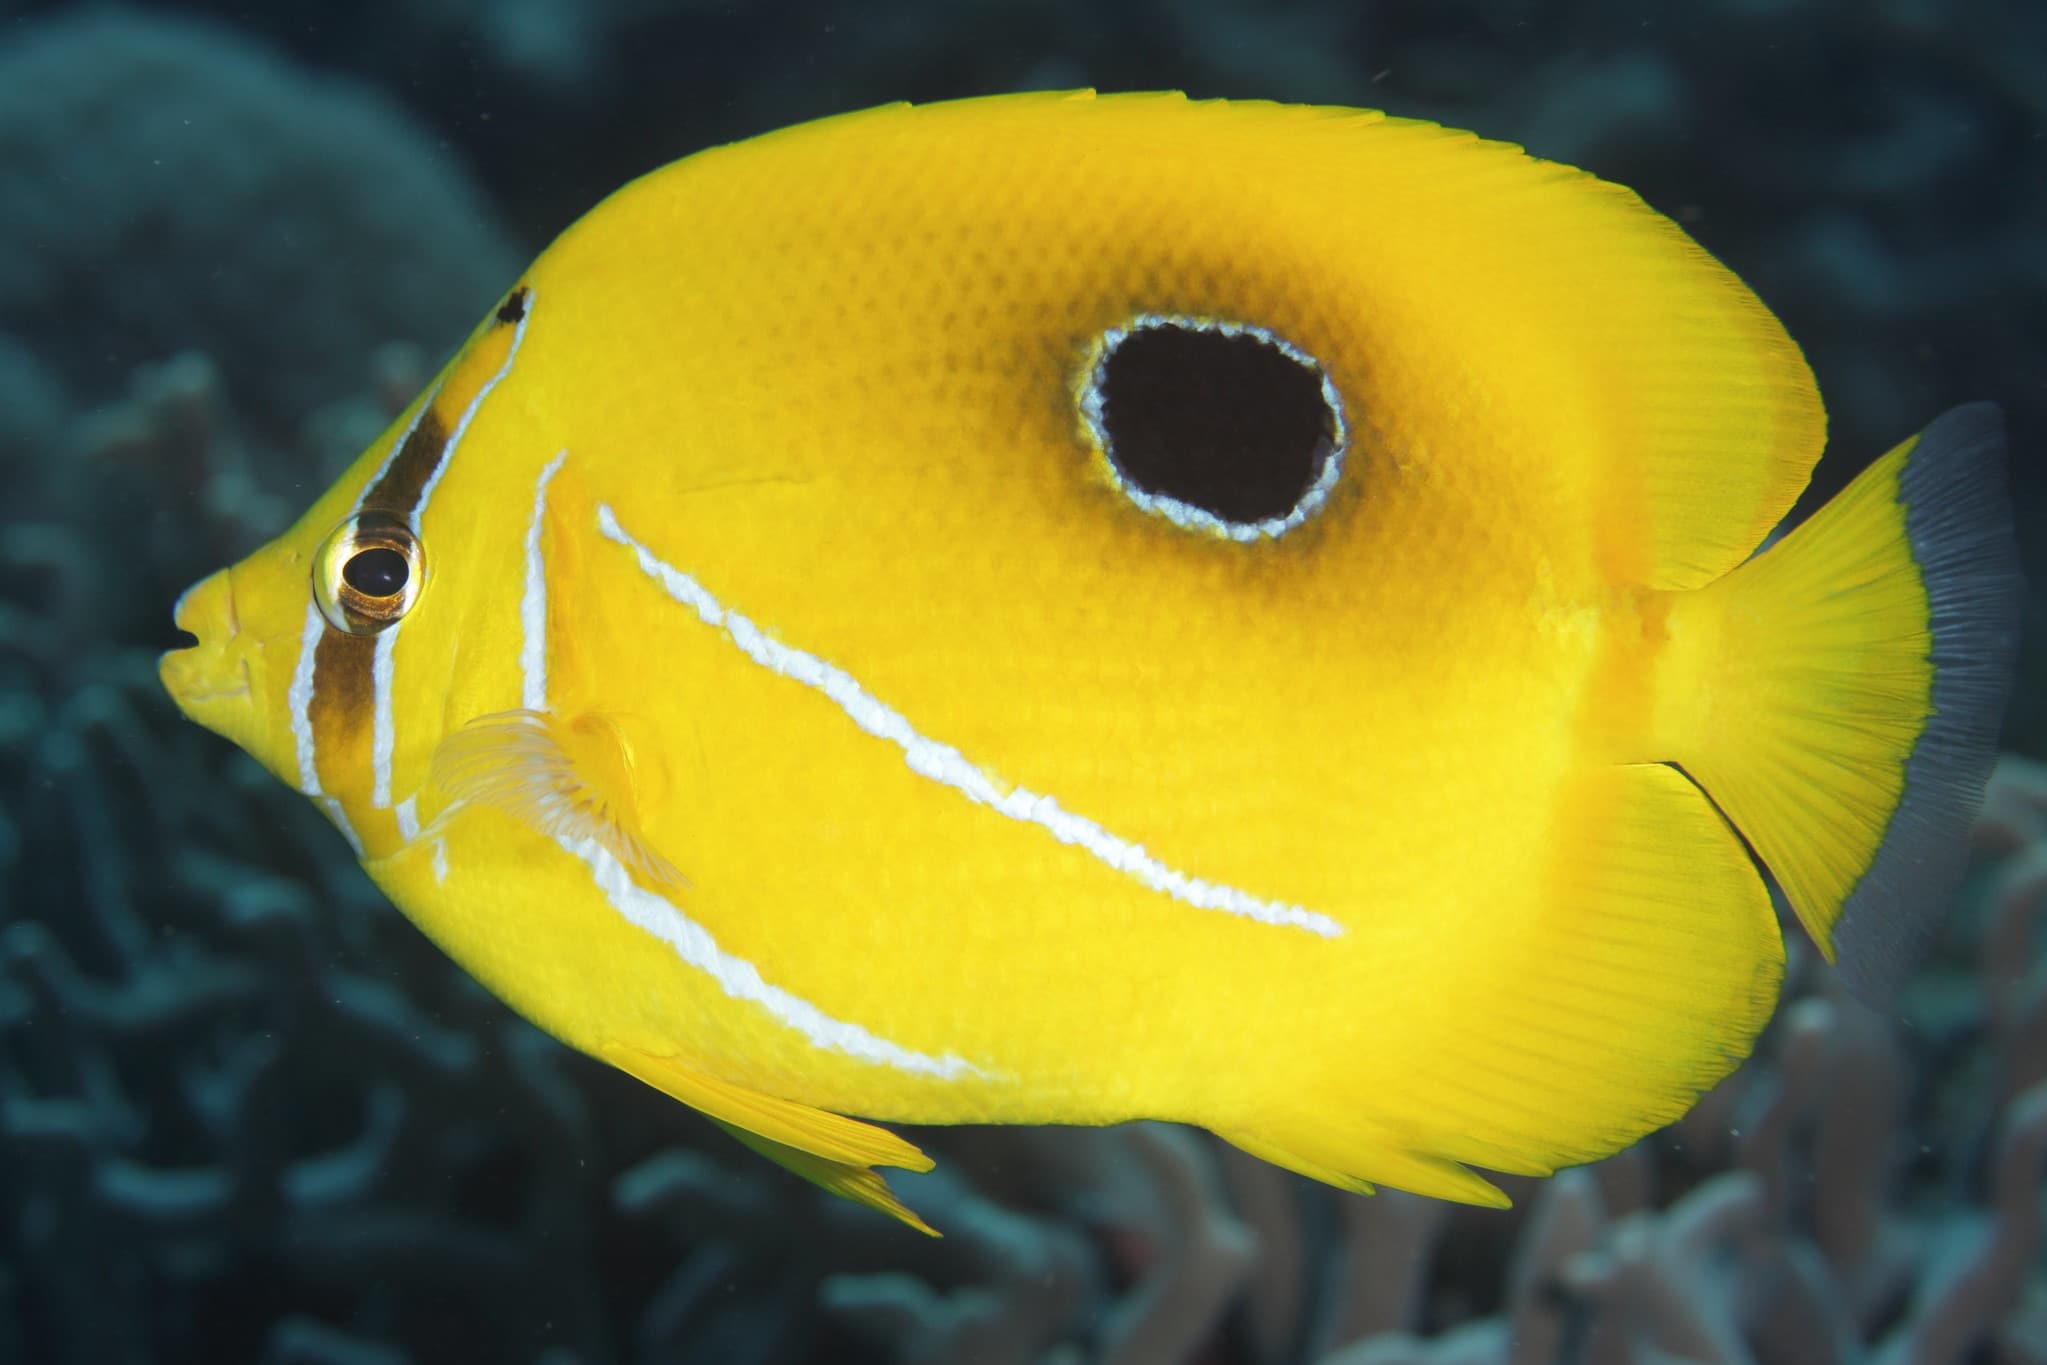
Which end is which? Many butterflyfish have dark stripes across their eyes and spots on their bodies, which are meant to confuse predators and allow the fish to escape. “Eyespots” are often found near the rear fin of the fish. The spot looks like an eye to the predator. This “fake eye” tricks the predator and costs it an opportunity to get food.
Photo Attribution: Bennett’s Butterflyfish by Klaus Stiefel [CC BY-NC 2.0 (https://creativecommons.org/licenses/by-nc/2.0/)] 10 June 2010 via Flickr. https://flic.kr/p/8c45wB


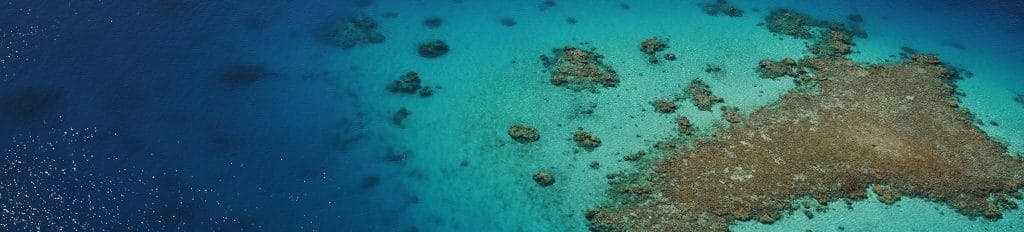
WHERE ARE CORALS FOUND?
Distribution is the geographic area in which a species can be found. In this unit, we will learn about the two major drivers of coral distribution.
Most people think that corals can only grow in warm subtropical and tropical waters; however, they are mistaken. Corals can also grow in higher latitudes and greater depths. These corals are often referred to as deep- or cold-water corals. They do not share the same environmental conditions as subtropical and tropical corals, which are referred to as warm-water corals. For now, we will focus on warm-water coral reefs and in Unit 8: Environmental Conditions we will learn about the environmental conditions that these reefs require for survival.
Fun fact
X

Fun Fact
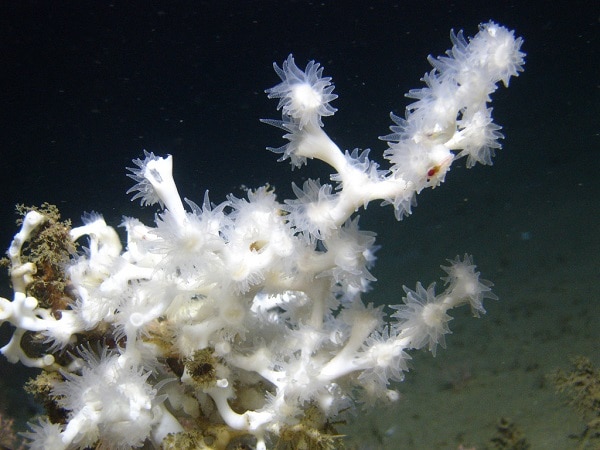
Lophelia pertusa is a stony coral that can live at depths of up to 9843 feet (3,000 meters)! You may be wondering, how can a stony coral survive at these depths without sunlight? The answer is that pertusa is a deep-water coral. Deep-water corals do not possess zooxanthellae. Instead, they are thought to obtain food from zooplankton and organic matter that is transported by currents or that sinks from the euphotic zone.
Sources:
Squires, D. F. 1959. Deep sea corals collected by the Lamont Geological Observatory. 1. Atlantic corals. American Museum Novitates 1965: 1-42.
By NOAA Ocean Explorer [CC BY-SA 2.0 (http://creativecommons.org/licenses/by-sa/2.0)], 29 September 2008 via Wikimedia Commons. https://commons.wikimedia.org/wiki/File%3ALophelia_pertusa_NOAA.jpg.
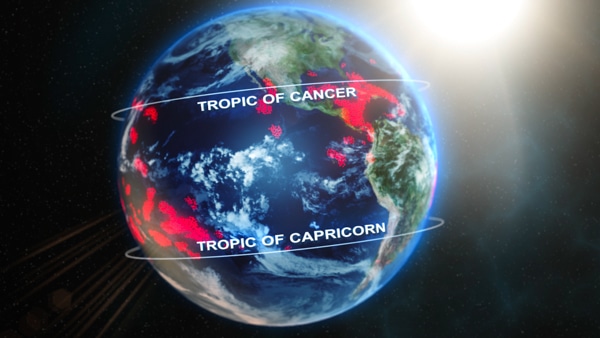
The tropics is a geographic region that is located between the Tropic of Cancer in the northern hemisphere (23.4378° N) and the Tropic of Capricorn in the southern hemisphere (23.4378° S) (figure 7-1). The subtropics extend from the Tropics of Cancer and Capricorn to 35° North and South latitudes.
Figure 7-1. Most coral reefs (in red) are located between the Tropic of Cancer and the Tropic of Capricorn.
Typically, coral reefs can be found in the tropics. There are some areas outside this range (in the subtropics) where coral reefs exist due to currents transporting warm water, such as parts of the Bahamas, Bermuda, Florida, Gulf of Mexico, and Japan.

WHAT IS A CURRENT?
An ocean current is the continuous movement of ocean water in a prevailing direction.
There are two main types of ocean currents: deep ocean currents and surface currents (figure 7-2). Deep ocean currents are currents that occur greater than 300 feet (100 meters) deep. They are driven by density, temperature, and salinity. Surface currents are currents driven primarily by wind, tides, and waves.
Figure 7-2. Major ocean currents – the red arrows represent where warm currents are found and the blue arrows represent cold currents.
In this unit, we will investigate how deep ocean currents work. In order to understand this type of current, we first have to understand the terms density, salinity, and temperature.

WHAT IS DENSITY?
Density is a physical property of matter, a substance that occupies space. The definition of density is the concentration of matter of an object. Density may also refer to how closely packed or crowded the material appears to be. Density is the same for a particular substance when measured at the same temperature and pressure, regardless of the quantity or shape of the sample. For example, a copper penny and a copper bracelet are going to have the same density despite the fact that the bracelet has a greater amount of copper.
The units of density are commonly expressed as grams per centimeter cubed (g/cm3) for solids, grams per milliliter (g/mL) for liquids, and grams per liter (g/L) for gases.
Think about density in terms of atoms that make up an object. For instance, let’s take a look at these cubes (figure 7-3). One cube clearly has more atoms (red circles) than the other. Atoms are the most basic unit of chemistry and they have different number of protons, neutrons, and electrons. Which cube do you think has a higher density? That’s correct! The cube with more atoms has a greater density because they are more closely packed. When the volume is the same and there is a greater mass, the density is greater. So we can say that the first cube has a greater density than the second.
Figure 7-3. Comparing density of cubes with the same volume
We can actually prove this mathematically, too. In order to find the density, we use the equation:
Density = mass/Volume or D = m/V
Mass: The amount of matter an object contains. The mass of a substance is determined by the mass of the atoms, molecules, or ions that make up the substance.
Volume: A measure of the amount of space an object takes up.
By taking the object’s mass divided by its volume, we can find the density of the object.
Say that the cubes in figure 7-3 have a volume of 64 cm3 and each atom has a mass of 4.0 grams. We can calculate the density of each cube.
| Cube 1 | Cube 2 | |
| Volume | 64 cm3 | 64 cm3 |
| Mass | 18 atoms x 4.0 grams per atom = 72 grams | 9.0 atoms x 4.0 grams per atom = 36 grams |
| D= m/V | 72 g/64 cm3 | 36 g/64 cm3 |
| Density | 1.125 g/cm3 | 0.5625 g/cm3 |
The math proves that the density of the first cube is greater than the density of the second.

SALINITY, TEMPERATURE, AND OCEAN CIRCULATION
We just learned about density. Seawater density drives deep ocean currents. Now we are going to learn about two factors that affect the density of sea water: salinity and temperature.
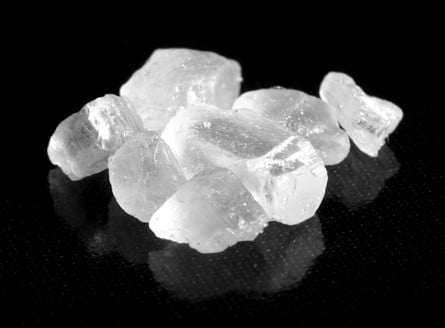
If you’ve been swimming at the beach, you know that the ocean consists of salt water. The salt in seawater is the same thing that we add to our food. Chemically, salt is a compound because it is made up of more than one element; it is known as sodium chloride (NaCl) (figure 7-4).
How does this relate to salinity? Salinity is the amount of salt dissolved in a body of water. Throughout the ocean and different bodies of water, the amount of salt fluctuates depending on factors such as evaporation, rainfall, runoff, and ice formations.
We measure salinity in parts per thousand (ppt). The average ocean salinity is 35 ppt. Let’s think of salinity like this: if we have 1,000 buckets, 35 of those buckets will be filled with salt and the other 965 will contain fresh water.
In areas where there is a greater addition of fresh water (due to rainfall or runoff), there will be lower salinity and lower density because the fresh water will dilute the salt water. When there are more ice formations or evaporation occurs, there is a higher salinity and higher density because there is less fresh water to dilute the salt water.
Ocean Temperature
Just like salinity, the temperature of the ocean also fluctuates. Temperature is the measure of how hot or cold something is. In physics, it’s defined as the measure of the kinetic energy of particles. It can be measured in Fahrenheit, Celsius, or Kelvin scale.
The ocean has three temperature layers. Study figure 7-5 to visualize the changes in temperature and depth.
- Surface Layer: Often this layer is referred to as the mixed layer because this is where winds and waves stir up the water. This layer is also highly influenced by solar energy (from the sun) heating up the water. The temperature is roughly that of the air above it.
- Thermocline: A layer of water located between the surface and deep water layers that rapidly decreases in temperature as depth increases.
- Deep Water Layer: The layer of water below the thermocline that slowly decreases in temperature as depth increases.
Figure 7-5. Temperature layers in the ocean – as depth increases, temperature decreases; there is a sharp change in temperature only in the thermocline.
Due to different climates, the depths of these ocean layers fluctuate throughout the world. The largest of these currents is referred to as the global ocean conveyor belt. It is more formally called thermohaline circulation. Let’s break down the word thermohaline.
thermo haline
temperature salinity
Thermohaline currents are driven by temperature and salinity.
Temperature and density have an inverse relationship, which means as temperature increases, density decreases, and vice versa. Think about this at a molecular level. As the temperature of water increases, the water molecules have more energy and move faster, causing the distances between them to begin to increase. This expansion causes the molecules to spread out and become less dense. As the temperature of the water decreases, the water molecules slow down and tightly pack together, causing them to become more dense.
Salinity and density have a direct relationship, which means as salinity increases, density increases, and vice versa. Again, think about this on a molecular level. Salt is composed of sodium ions (Na+) and chloride ions (Cl–). Each of these ions has mass. As we increase the number of ions, the mass also increases, causing the density to increase.
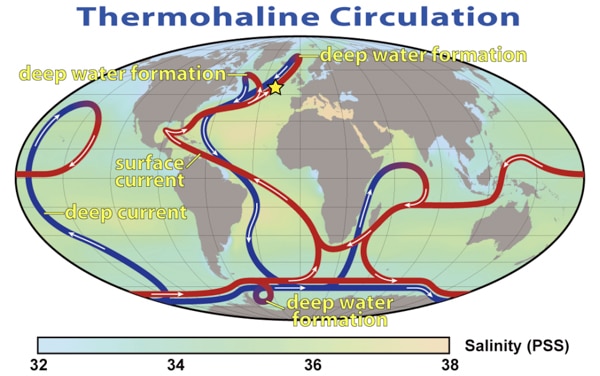
Now let’s apply what we just learned about temperature and salinity to thermohaline circulation (figure 7-6). Cold, salty water is more dense than warm, salty water and sinks. Warm, salty water is less dense and rises to the surface. This current starts where the Gulf Stream meets the Norwegian Sea. The Gulf Stream transports warm water north that has been heated in the lower latitudes. When this warm water gets to the colder climate in the higher latitudes of the Norwegian Sea, it cools and sinks. This bottom water will flow south and eventually make its way to Antarctica. Then the processes of warming and cooling occurs all over again. In time, this water will circulate the globe.
Scientists believe that it takes 1,000 years for the global ocean conveyor belt to make one cycle!
Figure 7-6. Thermohaline circulation – the red belts are warm surface currents and the blue belts are deep cold currents. The star marks the area where the Gulf Stream and Norwegian Sea meet.
Coral distribution is largely dependent on temperature, but now we know that both salinity and temperature affect ocean currents. Currents allow corals to have a wider distribution, providing warm water to the subtropics.
Fun fact
X
Fun Fact
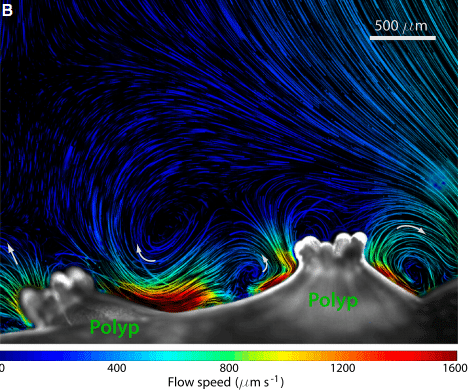 You might think that this is a beautiful piece of artwork that should be hanging in a museum. In fact, it’s an image from a high-speed video showing that cilia living on the surface of cauliflower coral (Pocillopora damicornis) beat back and forth creating small vortices (or water spinning in the same direction). Scientists believe that this is important because corals are dependent on currents to bring nutrients and food and get rid of waste products. Corals that create their own “current,” may have developed another survival mechanism.
Source: Shapiro, O.H., Fernandez, V.I., Garren, M.S., Guasto, J.S., Debaillon-Vesque, F.P., Kramarski-Winter, E., Vardi, A. & Stocker, R. 2014. Vortical ciliary flows actively enhance mass transport in reef corals. Proceedings of the National Academy of Sciences 111 (37): 13391-13396.
http://romanstocker.scripts.mit.edu/web/wp-content/uploads/2014/09/64.-Shapiro_etal_PNAS2014.pdf
http://video.mit.edu/watch/corals-as-engineers-28753/

ATTRIBUTIONS
Figure 7-2. By L30nc1t0 [Public domain], 10 August 2007 via Wikimedia Commons. https://commons.wikimedia.org/wiki/File%3ACorrientes-oceanicas.gif.
Figure 7-4. By Mark Schellhase (Own work) [CC-BY-SA-3.0 (http://creativecommons.org/licenses/by-sa/3.0) or GFDL (http://www.gnu.org/copyleft/fdl.html)], 25 July 2008 via Wikimedia Commons. http://commons.wikimedia.org/wiki/File%3ASalt_Crystals.JPG.
Figure 7-5. Adapted from University of Illinois. 2010. Retrieved February 10, 2014 from http://ww2010.atmos.uiuc.edu/%28Gh%29/guides/mtr/eln/upw.rxml
Figure 7-6. By Robert Simmon, NASA. Minor modifications by Robert A. Rohde also released to the public domain (NASA Earth Observatory) [Public domain], 29 March 2008 via Wikimedia Commons. https://commons.wikimedia.org/wiki/File%3AThermohaline_Circulation_2.png.
