 Hi Jeremy… Can you tell us about your involvement in the Living Oceans Foundation Global Reef Expedition?
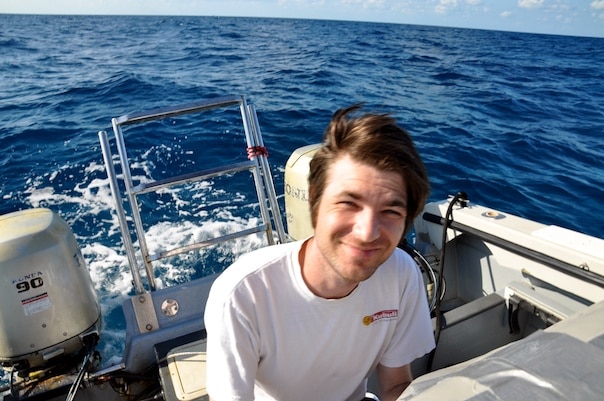
Sure, I’m a research assistant and a Ph.D. student in the National Coral Reef Institute housed at Nova Southeastern University’s Oceanographic Center and I work with Dr. Sam Purkis in the Remote Sensing Lab. Dr. Purkis has been working with the Living Oceans Foundation for several years now, and I became a Living Oceans Fellow in 2010. Our research here on Cay Sal Bank focuses on the collection of ground-truth information for the creation of benthic habitat and bathymetric maps. Essentially, we are trying to map the landscape of the bank using satellite imagery and the information we gather here in the field.
So, you’re using satellites to study the seafloor?
Yes, we start with hi-resolution imagery of the area that’s gathered by the WorldView-02 satellite, and then we compare the features in the satellite images with the video, digital photos, and depth soundings we are gathering here on Cay Sal Bank. What’s cool about what we’re doing is that we’re using this new satellite on a scale that hasn’t been used before, so we’re very much pushing the edge of what can be done with it. WorldView-02 is a relatively new satellite and offers a lot more spectral information than previous satellites, so instead of getting the standard red, green, blue channels like your digital camera (and previous satellites), we have four more channels of data to work with. We hope all that spectral information will improve our ability to develop better habitat maps. WorldView-02 also has a finer spatial resolution than previous satellites with each pixel covering a two-meter by two-meter area. With the satellite imagery, we will map a very large spatial extent (about 6,000 sq. km.), which really is an enormous coverage.

How do you actually go about doing your satellite groundtruthing?
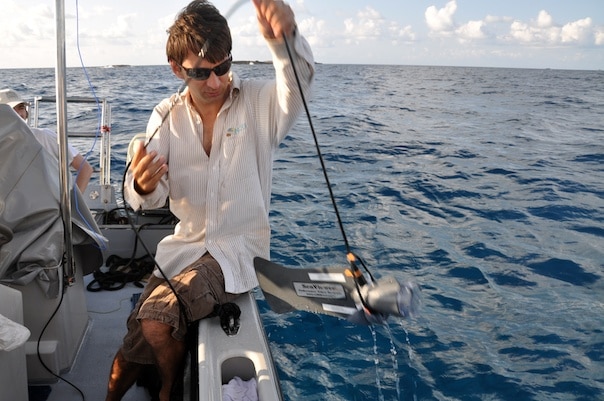
Well, from the satellite imagery we’re able to see different landscape patches on the bank, so each day we visit these patches in the small catamaran to find out what is actually present in the patch. At each of these locations, we drop a video camera over the side of the boat on a long cable where it captures 30-60 seconds of video of the seafloor. We can then compare what we’re seeing on this drop-cam to the spectral imagery from the satellite. So, far on this expedition, we’ve collected video at 375 separate survey sites.

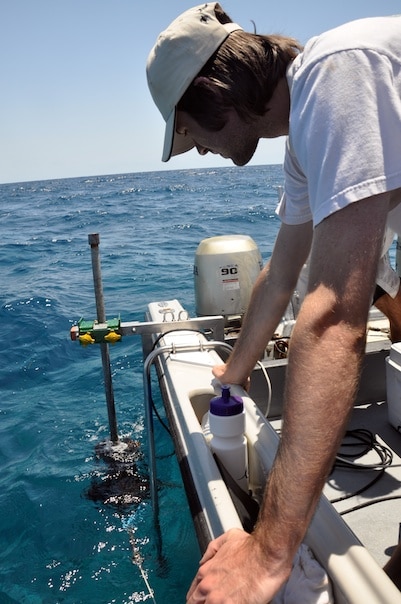
We also use an instrument called Hydrobox, which is a depth sounder very similar to fish finders. It emits an acoustic ping straight down into the water column which reflects off the seafloor. The sounder detects the reflected ping, and based on the timing of that ping, we get an estimate of depth. So, as we run transect lines up and down the bank, we have a little arm hanging off the side of the boat with the transducer head on it, which is emitting and detecting the ping, that captures the water depth under the boat along our course.

We have another similar tool called Stratabox. It’s similar to the Hydrobox in that it’s also an acoustic sounder, but it emits a more powerful ping at a lower frequency. Because of its power, the ping is able to penetrate through the soft sediments on the seafloor, like sand and mud, and the sensor is able to detect the reflection off the hard surface under the sediments. This hard surface is typically from the Pleistocene era and has been here for thousands of years, so we’re able to see how much sand has gathered here over the last 10,000 to 12,000 years. On this particular expedition, we’ve been using the Stratabox to look at the sinkholes that are all over Cay Sal Bank. We’re interested to see how the holes form, how much and what types of sediment have filled in these holes, and to understand the dynamics of the holes over long time scales. There are some really interesting patterns we’re seeing from the satellites related to these blue holes, so we’re gathering as much information about them as possible.
Once you’ve collected all of this data, what’s next? How does it all fit together?
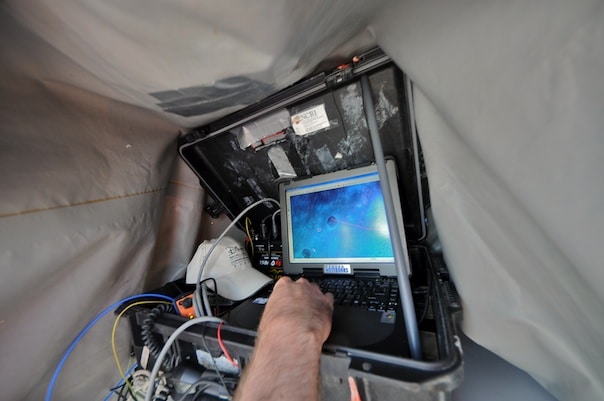
Well, a lot of our work is computer-based. We use computers on the boat in the field to gather data and then we use computers back at the lab to process the data. Once the expedition is over, we combine our water depth data, the drop-cam videos, and the satellite imagery to create benthic habitat and bathymetric maps. The bathymetric maps give us an idea of the seafloor topography while the habitat maps give us an idea of how each of the different habitats – like sea grass, sand, coral, or hard grounds – are distributed across the bank. The maps are important because they are a focal point that enables and supports other activities, such as implementation of conservation actions or research into the geometric properties of the habitats.
We give the bathymetric and habitat maps to the Living Oceans Foundation as well as the local government – in this case, the Bahamas National Trust (BNT). That gives BNT an enhanced understanding of their marine resources and how they’re distributed, so if they want to create a marine protected area or implement a fisheries conservation measure, they have an idea of where they can place it, leading to more successful conservation.
From the pure research side, we use the maps to investigate how these landscapes are formed and to look at the different geometries between the habitats. So, we might take a closer look at why sea grass is growing to a greater extent in one area versus another based on landscape factors. Ultimately, with my own research, I’m trying to understand how these landscapes evolve over time. We look at geologic time scales often and the hope is to understand what has caused them to form in the past and how they’re developing over time. We can then use that knowledge to understand how they may evolve in the future and how that may affect conservation.


Can you tell me more about why you’re interested in this work?
Well, one part of it is just the thrill of exploration. No one’s really explored the bank in the way that we are and this expedition gives us a chance to visit a place that hasn’t really been studied very much. Part of the fun of gathering ground-truth information is that by covering such a large area we see what’s happening on a larger scale than if we only studied one survey site in detail. This really complements the work of the diving team, as it allows us to better understand the dynamics of the bank at multiple scales. Also, I’m very interested in the underlying mathematics involved in the processing and analysis of the data and the modeling of spatial patterns. This works allows me to combine my interests in ecology, mathematics and conservation into one focal point; and create these bathymetric and habitat maps that can really affect the world in a positive manner.
To follow along and see more photos, please visit us on Facebook! You can also follow the expedition on our Global Reef Expedition page, where there is more information about our research and our team members.
Post by Liz Smith
(Images: Liz Smith; Satellite Map: WorldView-02 )